A quantitative approach to the markets without emotional bias
1
GET THE MACRO ALLOCATION / THESIS
2
COMBINE WITH OUR INDICATORS
3
GENERATE ALPHA WITH PROPER RISK MANAGEMENT
NOTABLE TRADES CLOSED THIS YEAR
| Instrument | % Return | Holding Period* | Strategy |
|---|---|---|---|
| MRVL | 189.80% | 119 days | Swing Trade Growth Stocks |
| OSCR | 115.22% | 111 days | Swing Trade Growth Stocks |
| EWY | 105.19% | 208 days | Global Indices Indicator ETF |
| ALAB | 103.67% | 93 days | Swing Trade Growth Stocks |
| ARM | 96.36% | 103 days | Swing Trade Growth Stocks |
| USO | 95.99% | 115 days | Oil Indicator |
| TQQQ | 90.07% | 51 days | BTC as a leading Indicator for Nasdaq 100 |
*Based on 360-day calendar
i3 EQUITIES INDICATORS (TOP TRENDING NOW)
Bitcoin as a Leading Indicator for Nasdaq 100 (Excess Annualized Return vs Benchmark = 34.32%)
Annualized Return = 53.96%
Excess Sharpe Ratio vs Benchmark = 0.52
Excess Annualized Return vs Benchmark = 34.32%
Bitcoin often acts as a leading indicator for the Nasdaq 100 due to shared market dynamics. Both are driven by risk appetite, liquidity, and investor sentiment toward growth-oriented assets.
Bitcoin, being more volatile and less regulated, tends to react faster to macroeconomic shifts, such as changes in monetary policy or inflation expectations. When Bitcoin rallies, it can signal rising confidence in tech-heavy markets.
Conversely, Bitcoin’s sharp declines often precede or amplify Nasdaq 100 corrections, reflecting risk-off sentiment. Data shows a correlation, with Bitcoin’s price movements sometimes leading Nasdaq 100 by days or weeks, though not always consistently.
This relationship stems from overlapping investor bases, including hedge funds and retail traders, who treat both as speculative bets on innovation and loose financial conditions, making it a barometer for broader market trends.
Our Indicator: We use a combination of trend-following, moving average, and relative strength variables to generate the output of this indicator. We trade the 3x leverage ETF (TQQQ)
.
Global Indices ETF Indicator (Excess Annualized Return vs Benchmark = 7.31%)
Annualized Return = 13.73%
Excess Sharpe Ratio vs Benchmark = 0.31
Excess Annualized Return vs Benchmark = 7.31%
This indicator employs relative strength and momentum strategies across 18 country ETFs.
The approach is to select, on a weekly basis, the country index ETF with the strongest relative strength and momentum compared to the others. It evaluates multiple timeframes, with the greatest emphasis on intermediate periods of several months. This helps reduce signal noise and focus on more robust trends.
A combination of momentum indicators is used, including moving averages, rate of change (ROC), and the relative strength index (RSI).
The indicator also incorporates risk management tools to move to cash when global equities show signs of weakness, increased volatility, or heightened overall risk.
The indicator’s statistics start in January 2002. Since then, it has been long equities approximately 80% of the time.
Cumulatively, the performance has been 4.5 times higher than a buy-and-hold strategy in the FTSE All-World ETF, with significantly better risk-adjusted returns, as illustrated in the chart below.
i3 COMMODITIES INDICATORS (TOP TRENDING NOW)
5-Year inflation leading indicator for OIL (Excess Annualized Return vs Benchmark = 18.73%)
Annualized return = 12.91%
Excess Sharpe Ratio vs Benchmark = 0.67
Excess Return vs Benchmark = 18.73%
The 5-year breakeven inflation rate is a market-based measure of expected inflation over the next five years. It’s derived from the difference in yield between two types of U.S. Treasury securities:
- Nominal Treasury Bonds (which pay a fixed interest rate and are subject to inflation risk)
- Treasury Inflation-Protected Securities (TIPS) (which adjust their principal and interest payments based on inflation)
Interpretation:
- If the 5-year breakeven rate is 2.5%, it means investors expect average inflation of 2.5% per year over the next five years.
- It reflects market expectations, not a guarantee—driven by investor sentiment, inflation risk premium, and supply-demand dynamics in the bond market.
Our Indicator:
According to our research, the trend in the 5-year breakeven inflation rate can act as a leading indicator for crude oil prices. This indicator analyzes the direction of the breakeven rate using relative strength and moving averages to assess the likely direction of oil prices.
When the trend in the breakeven rate is upward, there is a higher probability that oil prices will also rise—and similarly, a downward trend suggests potential weakness in oil prices.
.
Copper Indicator (Excess Annualized Return vs Benchmark = 11.59%)
Annualized Return = 15.30%
Excess Sharpe Ratio vs Benchmark = 0.42
Excess Annualized Return vs Benchmark = 11.59%
The Copper Indicator is based on momentum and relative strength strategies for the Southern Copper Corporation stock.
It combines moving averages, trending following approach and relative strenght among other markets to generate signals. The idea is to stay positioned when the momentum is favorable.
Southern Copper has the largest copper reserves in the industry and operates high-quality, world-class assets in investment grade countries.
OUR MOST POWERFUL TOOLS
25 outstanding indicators developed by who understands the markets and take a holistic approach across multiple asset classes, including:
US Equities, Commodities, Cyclicals, Global Index ETF, Emerging Markets ETF, Long & Short Growth vs Value, Bitcoin and Bonds.
These indicators are most effective when combined with our macro allocation / thesis. Not all indicators are used simultaneously, allowing us to focus on what truly matters without unnecessary complexity.
All of our indicators demonstrate excess Sharpe ratio relative to their benchmarks, meaning they deliver superior risk-adjusted returns.
3 Independent US Equities Portfolios with performances well above the benchmark.
Swing Trade Growth Stocks Strategy We present a comprehensive guide on how to swing trade growth stocks using our Ranking System. The tutorial outlines a powerful trading setup and includes real examples to help you understand the concepts clearly. Buy calls for the top growth stocks in the market.
Oscillators (“buy the dip” signals) that covers US Equities, Global Indices, Emerging Markets Indices, Commodities.
Alerts: You will have the flexibility to choose which alerts you want to receive from our tools, whether it’s notifications for a specific indicator when its signal changes or notifications across all indicators.
Alerts are delivered via email, WhatsApp, and Telegram, ensuring you stay informed in the way that suits you best. Our goal is to provide you with the best possible experience.
The Macro Picture Thesis (Allocation)
Once you subscribe, you will gain access to a detailed explanation of our macro allocation, the rationale behind our thesis, and timely updates whenever there are changes to the overall outlook.
Markets are dynamic, and high-impact events can occur without warning—such as pandemics or wars. It is essential to remain prepared and adaptable at all times.
By combining our top indicators with a top-down approach, we are confident in our ability to generate long-term alpha and navigate market turbulence with discipline and conviction.
DISTRIBUTION OF THE INDICATORS BY ASSET CLASS
“Success in trading demands the discipline to follow a proven strategy, the courage to manage risk ruthlessly, and the patience to let winners run.”
— Inspired by Jesse Livermore
EQUITY PORTFOLIO (TOP TRENDING NOW)
TOP 20 Stocks Portfolio
Cumulative Return (since Mar, 2024) = 83.99%
S&P 500 Return = 44.90%
Sharpe Ratio = 1.30
This portfolio is rebalanced in the first week of each month and the stock picking is purely guided by
our Stocks Ranking System as we select the TOP 20 stocks within our ranking.
Our Ranking System is based on relevant criteria such as Value, Growth, Financial Health,
Momentum, Future Growth, and Technical Analysis.
“Success in trading flows from the discipline to trust the process, the precision to control risk, and the strategy to harness patterns others can’t see.”
— Inspired by Jim Simons (Renaissance Technologies)
OTHER TOOLS YOU WILL HAVE ACCESS TO
i3 US Ranking System is a weekly ranking we provide to clients based on relevant criterias such as Value, Growth, Financial Health, Momentum, Future Growth, and Technical Analysis.
Weekly Macro Report Every Monday, you will receive a macro report divided into three parts, each containing relevant information. The structure of the report is as follows: Summary of the main events, top chart posted on X during the previous week, market insights.
Research Reports Whenever we identify an interesting opportunity in a company, sector, or asset class, we will share a detailed research report. This is a flexible, on-demand resource.
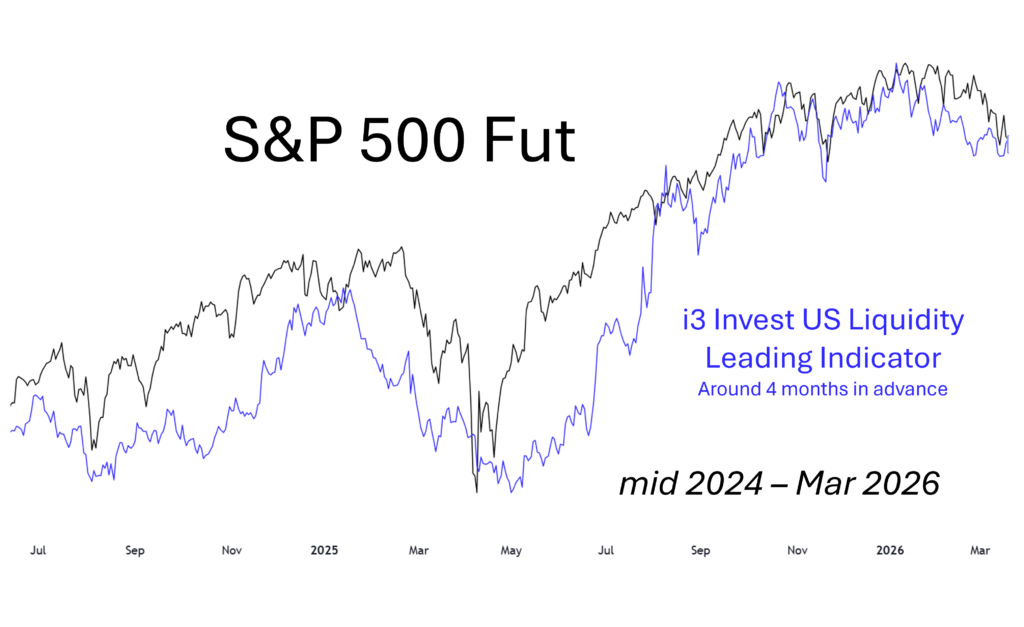
i3 Invest leading Indicator : Our proprietary indicator, based on U.S. liquidity, is designed to anticipate the direction of the equity market with a high degree of accuracy. As shown in the example below, it has demonstrated strong predictive power from mid-2023 through March 2026.
That said, there are periods when the correlation decouples. As such, this indicator should be used as a complementary tool rather than a standalone predictor.
14 DAYS FREE TRIAL

ABOUT THE FOUNDER
Hello, investors!
My name is Guilherme Tavares, and I have a genuine passion for the financial market.
For over 15 years, I have been dedicated to investments, accumulating a wealth of knowledge and experience.
Throughout my career, I have worked in great institutions such as BNP Paribas and BTG Pactual, where I had the opportunity to refine my skills and gain invaluable insights.
I invite you to join me on this journey, where we can navigate the financial landscape together and seek prosperous opportunities.
In the world of investing, data-driven decision making is becoming not just a trend, but a necessity. i3 Invest develops quantitative strategies to find optimal entry and exit points in financial markets. Algorithmic analysis, machine learning and statistical modelling are key tools to minimise risk and achieve stable results in the long term. Using data to predict market movements offers a significant advantage over intuitive methods.
A sound approach to money management is important not only in investments, but also in other areas where financial strategies are involved. For example, choosing reliable online casino platforms for additional income requires careful analysis. Before making decisions, it is worth studying the conditions, payout ratios and reputation of the resource. A detailed review of available sites can be found at
https://gb-scaletrucks.de/schweiz/, where you can check their rating, the level of bonuses and much more. This approach allows you to avoid accidental losses and find the best options for financial transactions.
The use of data and statistics helps to make informed decisions in any sphere, whether it is investing in the stock market or choosing financial instruments for alternative income. Comprehensive analyses and a well thought-out strategy are the key to successful results in the long term.
FAQ
.
I am not sure if I have to execute the trades, or do you handle the execution?
We don’t execute any trades; we are not a hedge fund or investment fund.
Our service is to provide access to our indicators, portfolios, oscillators, research, etc.
Why don't you have free trial?
Our strategies, portfolios, and research are the result of extensive analysis, expert insights, and proprietary methodologies.
Offering this content for free, even temporarily, could undermine its value and the hard work that goes into creating it.
I am very interested! Could explain more what I will receive?
After subscribing, you will have instant access to all features, including: indicators, oscillators, portfolios and research.
Everything is easy to understand, regardless of your experience in the financial markets.
You will have the flexibility to choose which alerts you want to receive from our tools, whether it’s notifications for a specific indicator when its signal changes or notifications across all indicators, oscillators, portfolios, etc. Alerts are delivered via email, whatsapp and telegram
Can I cancel at any time? Do I have any refund?
You can cancel your subscription at any time without any additional cost.
However, similar to most services in this industry, we do not offer any refunds after cancellation.
How do I know you are trustworthy and not a scam?
Reputation and Transparency:
You likely discovered our services through our CEO’s presence on Twitter (X).
Our CEO is known for his meticulous, serious, and unique analysis, charts, and knowledge. His consistent track record and transparent communication speak volumes about our commitment to quality and integrity.
No False Promises:
We don’t engage in any “get rich quick” schemes or sell unrealistic dreams. Our approach is straightforward and grounded in solid research and proven strategies.
We focus on delivering outstanding services that genuinely help our clients make informed investment decisions.
Client Testimonials and Track Record:
Our long-standing positive track record, along with testimonials from satisfied clients, further reinforces our credibility. We have a history of providing valuable insights and strategies that have consistently helped our clients achieve their financial goals.
Comprehensive and Clear Services:
We offer detailed guides and comprehensive support to help you navigate our services effectively.
This transparency ensures you understand exactly what you’re getting and how to use it to your advantage.
Are the website and payment safe?
Yes! Our website is highly secure, and all payments are encrypted and follow strict safety and data protection protocols.
If you still have any doubts, you can verify our security online using platforms like this one:
https://www.ssltrust.com.au/ssl-tools/website-security-check
TESTIMONIALS

In my opinion, i3 Invest offers one of the best services in the industry. The tools cover the broader market and really help improve my performance, while also giving me peace of mind knowing that the person behind it is highly focused on risk management.
It’s also worth mentioning the excellent value for money, which is not easy to find.
5 stars!
Joel
Retail Trader

i3’s tools were a tremendous help during the turbulent year of 2022. I integrated the some of them into my own strategies, and without a doubt, it significantly contributed to my success. I finished the year with positive returns and, by June 2022, I was recognized as the top popular investor on eToro within my risk range. Unfortunately, in 2023, I allocated only 5% of my portfolio to i3’s strategy, and it was not a good year for me. This year(2024), I have increased my use of i3’s portfolios as a guide, and my performance has greatly improved!
Evelyn (EWB Trader)
Popular Investor at eToro
The expertise, knowledge, and unwavering dedication demonstrated by the i3 Invest team are truly exceptional. Their comprehensive market insights and meticulous stock analysis have been an indispensable asset, especially amidst these challenging economic conditions. Their guidance has not only provided clarity but also instilled confidence in navigating uncertain markets. I am incredibly grateful for their invaluable support, which has undoubtedly contributed to my financial success and resilience during these tough times.
Adonis
Retail Investor, USA
contact us
Let us know what you are thinking: